Anomaly Detection in JaguarDB
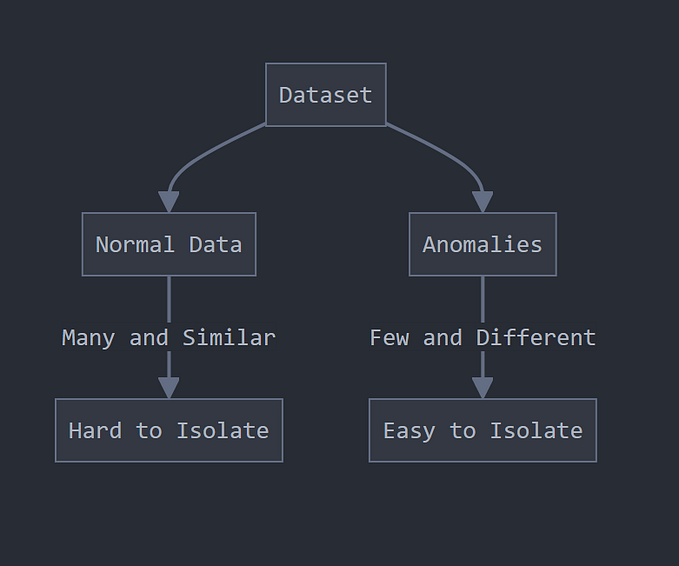
Jaguar vector database is pioneering the way data scientists approach anomaly detection. It provides a structured and efficient means of storing and querying data, enabling organizations to analyze patterns and deviations with remarkable precision. This innovative technique not only streamlines the process of anomaly detection but also enhances the accuracy of identifying potential threats. As the business landscape continues to evolve in an increasingly digital world, leveraging vector databases for anomaly detection has become a strategic imperative for enterprises seeking to safeguard their operations and data from malicious activities.
The API for analyzing anomaly is shown below:
select
anomaly(VECCOL,
'type=DISTANCE_INPUT_QUANTIZATION,slices=N')
from pod.store
where the type specifies the distance type and quantization levels of vectors; the parameter slices is the number of slices that divides 4-standard deviation span of the distribution of all the vectors in the vector store. The default value of slices is 20. Some examples of anomaly detection are listed as follows:
select
anomaly(vc,
'type=euclidean_whole_float')
from myvector;

select
anomaly(vc,
'type=euclidean_whole_float, slices=30')
from myvector;
The result would look like a list of Json objects:
[{"sigma":"0.1","prate":"0.9"},{"sigma":"0.3","prate":"0.9"},{"sigma":"0.5","prate":"0.7"},{"sigma":"0.7","prate":"0.7"},{"sigma":"0.9","prate":"0.7"},{"sigma":"1.1","prate":"0.6"},{"sigma":"1.3","prate":"0.6"},{"sigma":"1.5","prate":"0.6"},{"sigma":"1.7","prate":"0.6"},{"sigma":"1.9","prate":"0.6"},{"sigma":"2.1","prate":"0.5"},{"sigma":"2.3","prate":"0.4"},{"sigma":"2.5","prate":"0.4"},{"sigma":"2.7","prate":"0.4"},{"sigma":"2.9","prate":"0.4"},{"sigma":"3.1","prate":"0.4"},{"sigma":"3.3","prate":"0.4"},{"sigma":"3.5","prate":"0.4"},{"sigma":"3.7","prate":"0.2"},{"sigma":"3.9","prate":"0.2"}]Graphically the result can be viewed as the following:

The histogram graph displays the proportion of vector components that deviate beyond multiples of standard deviation (sigma) values within their distribution. For instance, at a sigma value of 1.7, approximately 55% of the vector components are observed to fall outside the range of 1.7 standard deviations from the mean of their respective vector components. With such insights, one can evaluate the anomaly of vectors and determine the threshold values to classify vectors as anomalous, which is describe as follows.
Often a vector data is checked to see if it is anomalous from the main body of dataset. The API for detecting anomalousness is shown below:
select
anomalous(VECCOL,
'type=DISTANCE_INPUT_QUANTIZATION,activation=[sigma1:percent1&sigma2:percent2&sigma3:percent3&…]')
from pod.store
where the type specifies the distance type and quantization levels of vectors; the parameter activation specifies one or more “sigma:percent” pairs instructing how much percent of vector components must be greater than the sigma value in order to be classified as anomalous. For instance, if activation is “0.3:70&1:50&1.5:30&3:10”, then at 0.3 times of standard deviation(Sigma), there must be more than 70 percent of vector components that exceed this 0.3*sigma value; and at one Sigma, there must be more than 50 percent of vector components that exceed this one sigma value; and finally at three Sigma, there must be more than 10 percent of vector components that exceed this one sigma value. If any condition is not met, then the query vector is not classified as an anomalous vector.
select
anomalous(vc,
'type=euclidean_whole_float,activation=[0.3:60&1:50&1.5:30&3:10]')
from pod.mystore;
The result is a Json string telling if “anomalous” is YES or NO.
{"anomalous":"YES","percent":"74&60&40&12","activation":"0.3:60&1:50&1.5:30&3:10"}The anomaly detection feature in Jaguar Vector Database is exceptionally beneficial, offering critical insights into vector distributions for identifying anomalous data or outliers. This functionality is particularly valuable in various applications such as fraud detection, network attack identification, data cleansing, and preparation of high-quality, noise-filtered data for machine learning. Additionally, it plays a crucial role in monitoring and securing real-time business transactions, making it an indispensable tool in these contexts.